 One of the tests I have to do in my analysis of sludge from the Upflow Anaerobic Sludge Blanket (UASB) reactor is to find out the size distribution & mean diameter of the sludge particles / biogranules. Basically, the bigger, the better. Why is this so? Well, there are diverse schools of though in this area & there still isn't a unified theorem about how we can explain the biogranulation process. Nevertheless, research is still on-going in this field of study & the implications could be tremendous. We could have a cheap & efficient way of treating water to make it potable & millions of people around the world will have access to drinking water. It could be a way for third world countries to improve their standard of living. No amount of money can have such a big impact on the lives of so many people.
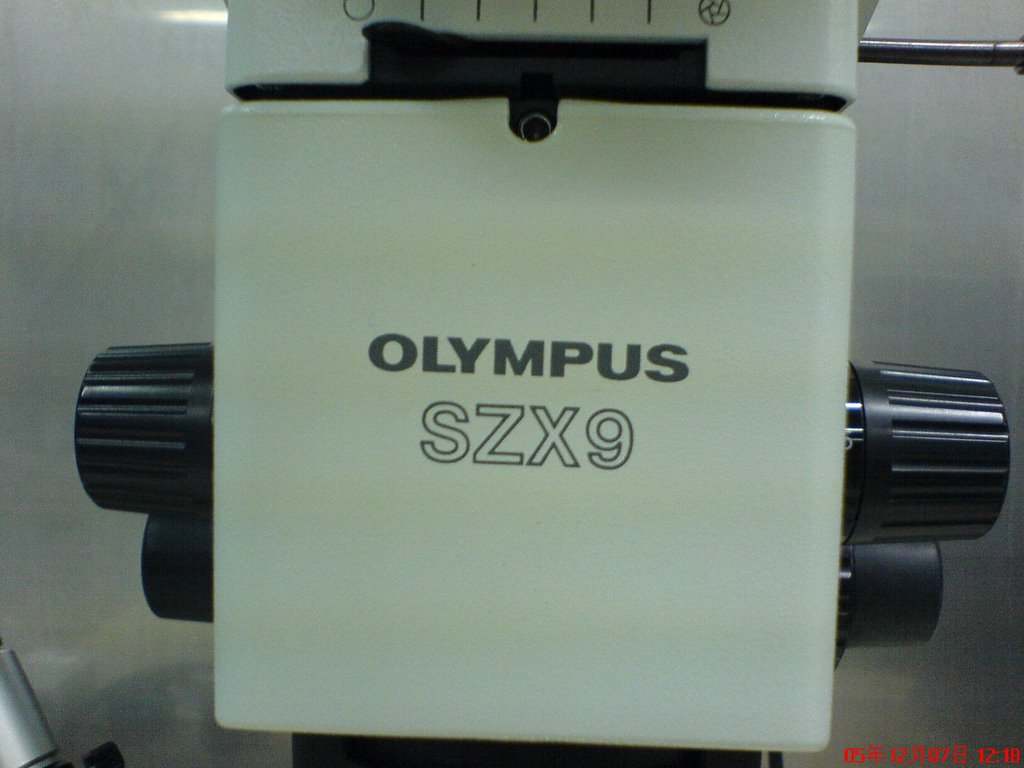
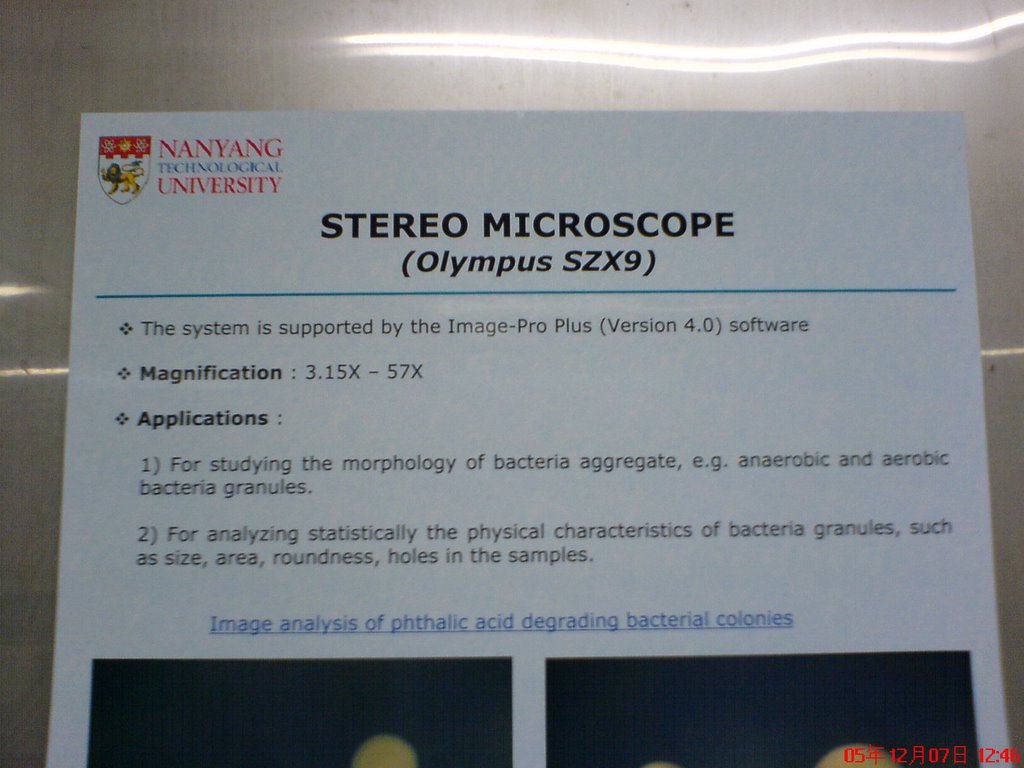 The first step is to obtain a small sample from one of the reactor which have varying Hydraulic Retention Time (HRT - 6hrs, 12hrs, 18 hrs, 24hrs) & simply just put it into a glass dish & place it under a powerful microscope. It is connected to a normal computer & using some special software, an "photograph" is taken of the sample & we define which area of the "photograph" we want to be considered as a "particle". Using statistics, a distribution graph is tabulated & the results can be recored in an excel file. It's a simple experiment, but interpreting the results will require some background knowledge on the workings of the UASB reactor & the biogranulation process which includes the parameters by which we vary operating conditions, e.g. HRT, organic loading rate, upflow velocity, etc.
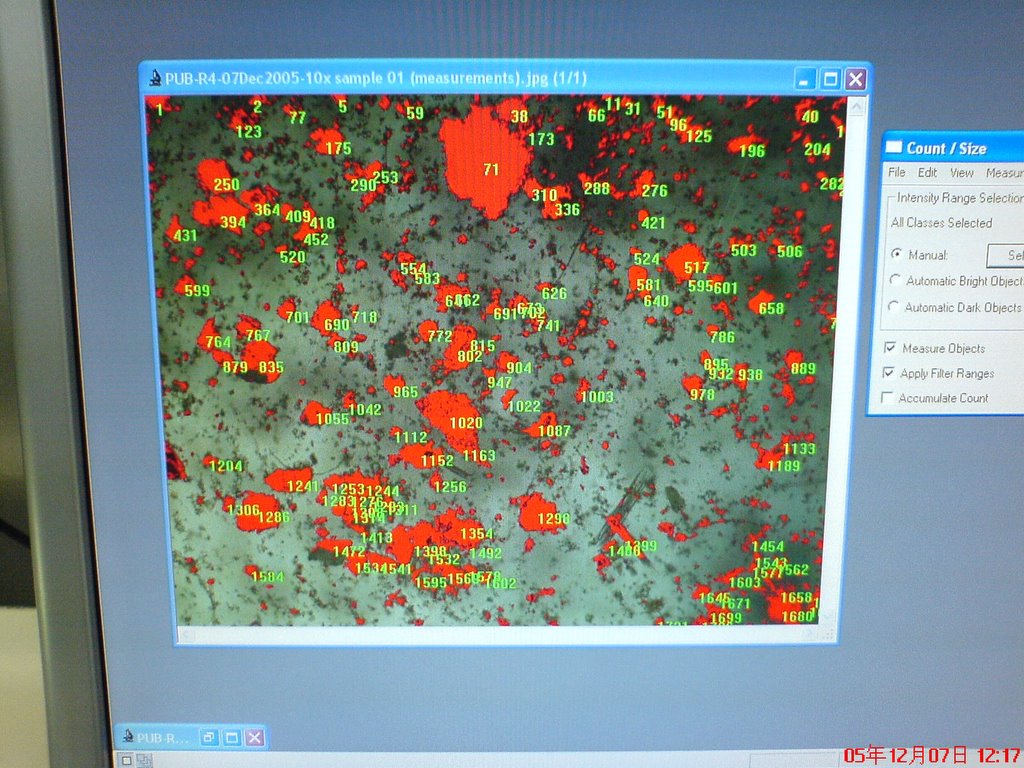 Ja neh!!!
Wednesday, December 14, 2005
Particle size analyzer / image analysis
Posted by raymond chng kwang hwee at Wednesday, December 14, 2005
Labels: school
Subscribe to:
Post Comments (Atom)
0 comments:
Post a Comment